
Is This Thing On? Leveraging Real-Time Video Data with ClickHouse

Video engagement and performance data are the secret sauce to understanding how viewers interact with content and how app developers can level up their user experience. This data includes metrics like the number of views, watch time, error rates, and buffering events.
Getting a handle on viewer engagement helps content creators and platforms tweak their videos to keep audiences hooked and make smart, data-driven decisions to boost their overall content strategy. Performance metrics can spot technical issues and fine-tune delivery to ensure smooth playback.
At Livepeer Studio, our first crack at serving this data was slow, pricey, and a pain to scale. We needed to cut down on data latency and make cost scaling more efficient.
Original Solution
Before we get to the hero of our story, let’s take a look at where we started. Our first iteration was a classic “use-what-you-have” approach, which worked well until our usage skyrocketed from 665k views to 108M (a whopping 161x increase) in just one month.
Here’s a quick look at the system:
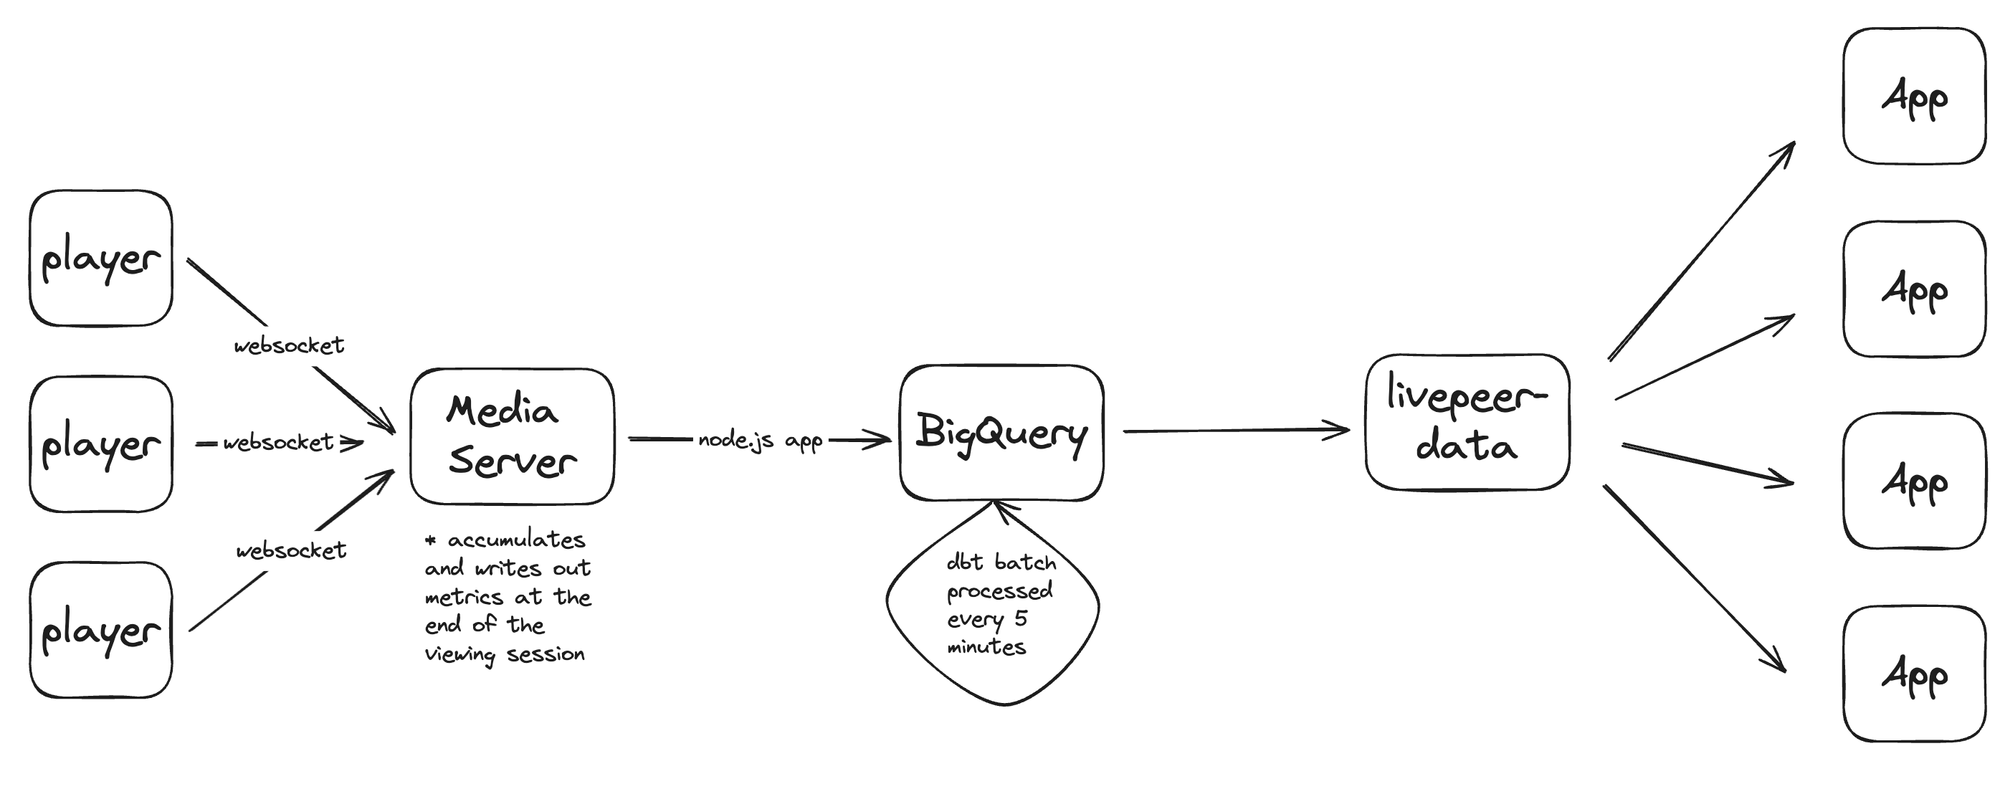
- The player sends updates to our media server via a WebSocket.
- The server collects metrics throughout the viewing session and sends them off when the connection ends.
- The data travels to a Node.js app via a UDP connection, which uploads it to BigQuery.
- Every 5 minutes, the data is batch-processed in BigQuery using a dbt model in a Kubernetes cron job.
- Our API handles incoming requests, pulls the data from BigQuery, and delivers it to users.
Shortcomings
One year and a billion views later, the flaws were pretty obvious. It was slow, expensive, and didn’t scale well.
Slow
Speed was a problem in two major ways:
- Data Latency: The time between an event happening and it being ready in the database was equal to the length of the viewing session plus 5 minutes. So, if a viewer watched for an hour, their data wouldn’t be available for analysis until an hour and 5 minutes later. This delay was a real headache, especially when trying to quickly spot issues like errors that might be happening within the first few minutes of a session.
- Query Speed: Non-cached queries in BigQuery took about 750 milliseconds on average. Ideally, this should be 2 or 3 times faster. The slow query speeds made it tough to provide timely data to our users, affecting their ability to make quick, data-driven decisions.
Inefficient, Expensive Scaling
Our BigQuery-centric approach had some serious cost issues, which got worse with more usage. Ideally, costs should get more efficient with increased usage and be specific to each user. Unfortunately, neither was true for BigQuery.
- Usage-Based Billing: BigQuery’s costs increase as it processes more data, leading to a linear cost increase. About 90% of our BigQuery costs came from batch processing incoming data, making our costs stuck to this linear increase.
- Connected Usage: Ideally, the resources needed to query a user's data would depend only on their own usage. Smaller users would be cheaper, and larger customers would be more expensive, but separate from each other. However, BigQuery's partitioning method doesn't work well for this. It only allows partitioning on one column, usually a timestamp, like each day. This means each user's data isn't partitioned, and a big user can make it more costly to query the whole partition, making it harder to design fee structures that pass on costs to customers.
Despite these challenges, our original solution was a testament to our ingenuity and resourcefulness. It reminded us that perfection isn’t needed right out of the gate. We learned, adapted, and got a better understanding of our users’ needs.
New Solution
And now, the exciting sequel! We did a complete rewrite starring ClickHouse.
For those who aren’t familiar, ClickHouse is a columnar database management system known for its high performance, scalability, and ability to handle large volumes of data with super fast queries.
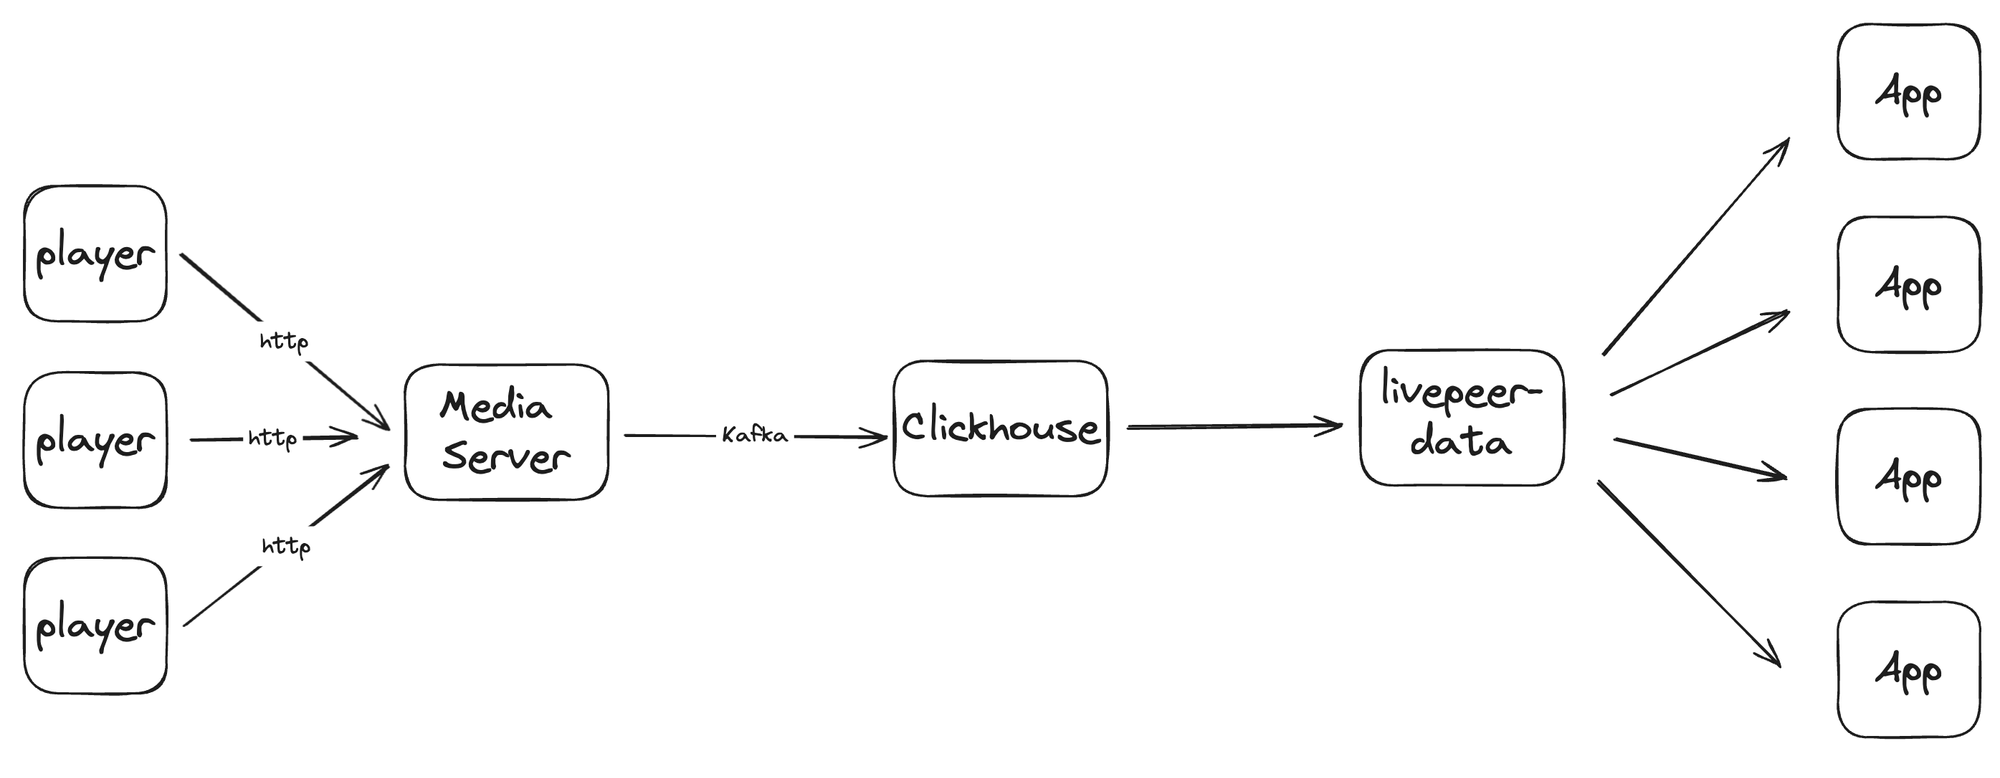
Here’s how data flows through our new ClickHouse-centric system:
- The Player: Collects client-side metrics and events, sending a JSON object to our media servers every 5 seconds (heartbeat).
- Catalyst: Takes the incoming data, spices it up with server-side info, and sends it to Kafka.
- Kafka: Swiftly ferries the data between our servers and ClickHouse.
- ClickHouse: Stores the incoming data and serves it up for lightning-fast queries.
- Livepeer Studio Data API: Queries ClickHouse and delivers the data to users.
But Did It Work?
Oh, absolutely. This new setup is a total game-changer. Here’s how our ClickHouse-based system tackles each of the original issues:
Fast
We wanted to fix two main speed issues: data latency and query speed.
- Data Latency: Improved by 98%, dropping from at least 5 minutes to a median latency of just 7 seconds. This includes the time it takes for the player to emit the “heartbeat” until it arrives in ClickHouse, ready to be queried.
- Query Speed: Improved by 90%, reducing the average query time from 750 milliseconds to just 82 milliseconds. This means our system can now handle a much higher volume of queries in a shorter amount of time, giving users near-instant access to crucial data.
Affordable, Efficient Scaling
Our ClickHouse-based setup offers a much more affordable pricing model by eliminating usage-based billing and switching to cluster-based pricing. We now pay for reserved capacity, which has turned out to be way more cost-efficient. Despite paying roughly the same price as before, we’re only using about 10% of our capacity, leading to a 90% effective reduction in costs.
Secondly, ClickHouse’s partitioned approach is perfect for this application, allowing a cascading, hierarchical partitioning method that keeps user’s data separate. This means that as usage from one customer spikes, the resources needed to query other users stay steady.
So What?
This new low latency and blazing-fast query speeds have unlocked a whole new world of “real-time” viewership features. We now offer real-time view counts, real-time error rates, and more. From a performance perspective, we’re enabling real-time data retrieval, making it possible for our clients to make quicker, data-driven decisions, all while being more cost-effective!
The benefits of our new architecture extend beyond this product, laying the groundwork for future innovations in our analytics stack. As we continue to refine and expand our capabilities, we’re excited about the potential to offer even more robust insights and tools to our users, like an in-depth “stream health” pipeline to give developers a clear view of their stream's health from glass to glass.
Thanks for joining us on this journey. Stay tuned for more updates as we keep pushing the boundaries of what’s possible with real-time data analytics.